

Operational dashboards
Surface current activity, workload, exceptions and service status.
- Role-specific views
- Current operational indicators
- Clear exception states

From data to useful decisions
Turn operational records into useful dashboards, clear reports and decisions your team can explain.
How we help
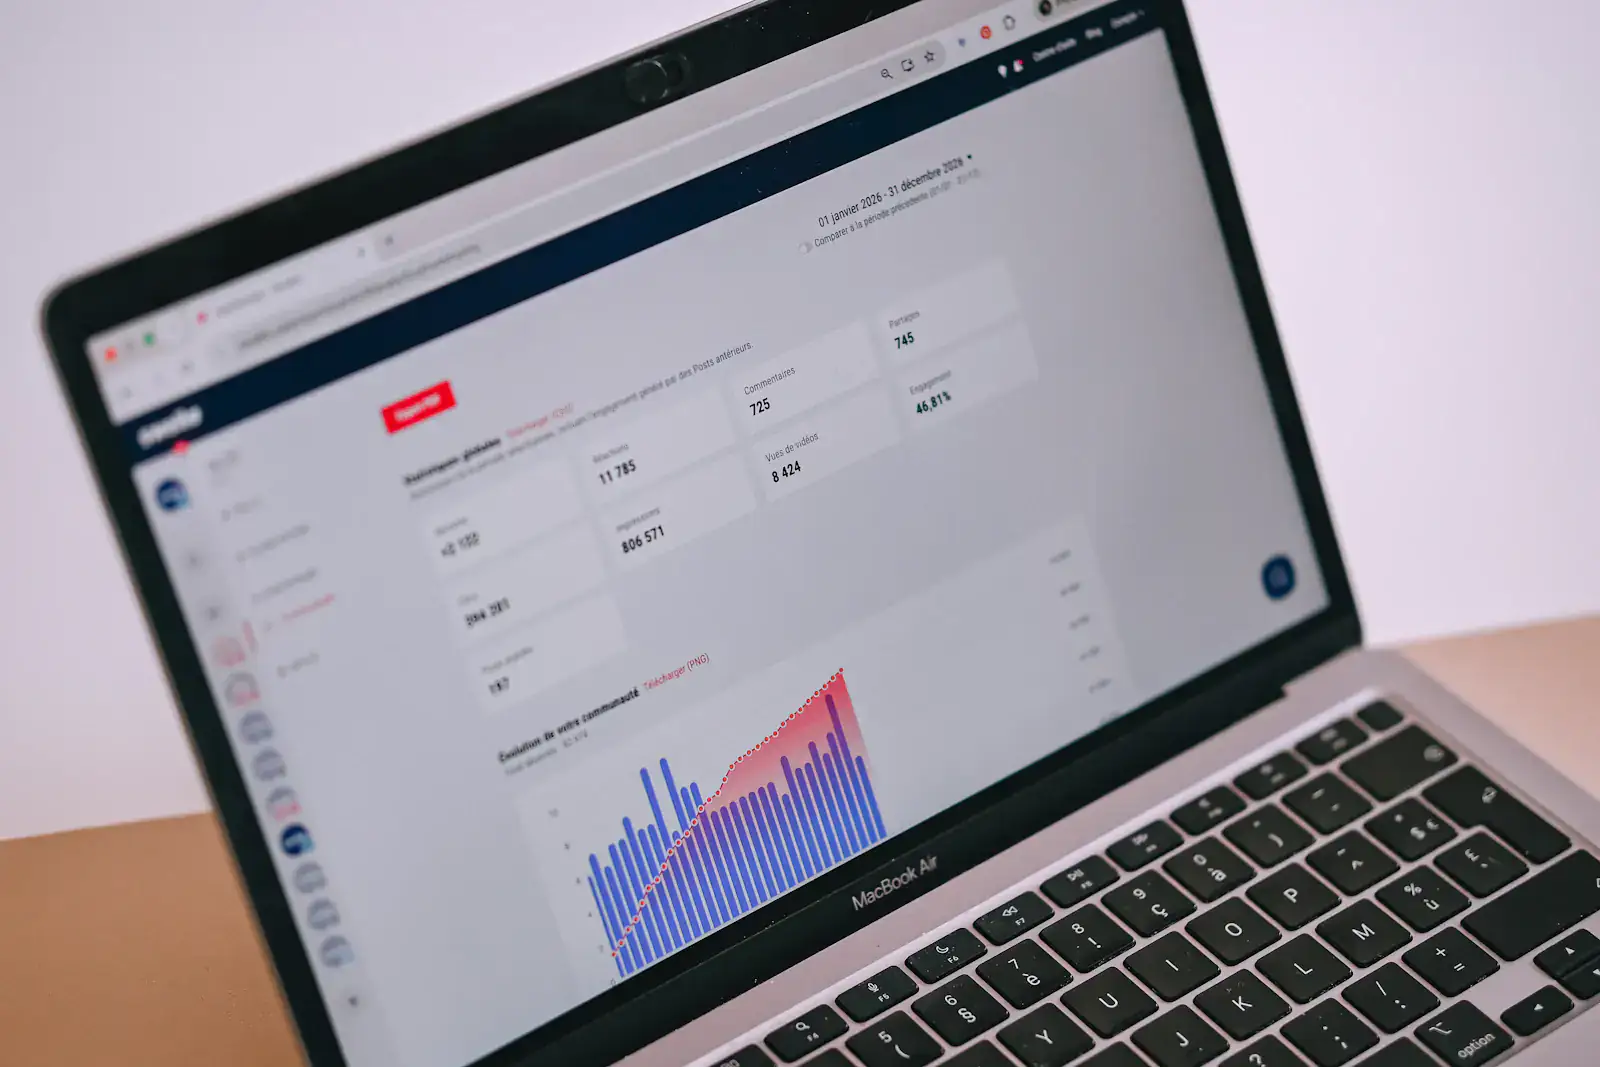
Reports are only useful when people can trust the numbers and understand what action they support. We help organisations identify the measures that matter, improve how source data is captured and present information in views that fit the decisions managers make.
From daily operational dashboards to scheduled management reports, we bring relevant information together with clear definitions and appropriate access. Where forecasting or predictive methods are suitable, they are introduced with their limits made clear and human review kept in the process.
Where we focus
Start with the decision, then provide the context and data behind it.
Surface current activity, workload, exceptions and service status.
Provide consistent summaries for planning, review and accountability.
Present patterns in a way that is easy to scan, compare and discuss.
Prepare reliable historical data before considering predictive insights.
Frequently asked questions
From your existing systems and spreadsheets. We agree the source of each number so managers trust what they see.
Yes. Dashboards can be paired with scheduled reports by email for managers who prefer a summary.
The size of the first release, integrations, data migration, security needs and testing. We scope these after an initial conversation and send a written proposal rather than quoting a one-size-fits-all figure.

Designed for operations
From first conversation to launch
Each stage keeps the scope, decisions and next steps visible to your team.
Identify who needs the report, which decisions they make and how often.
Check quality, availability, ownership and definitions across source systems.
Build clear dashboards and reports, then review them with intended users.
Document indicators and improve reporting as operational needs evolve.
Applied in practice
Explore a fleet platform that brings live telemetry, alerts and operational status into view.
Explore more
Move from a focused project to connected software, dependable operations and steady improvements.
Ready to take the next step?
Share the workflow, challenge or goal you have in mind. We’ll help you decide what should happen next.